JStorm UI Introduction
UI Overview
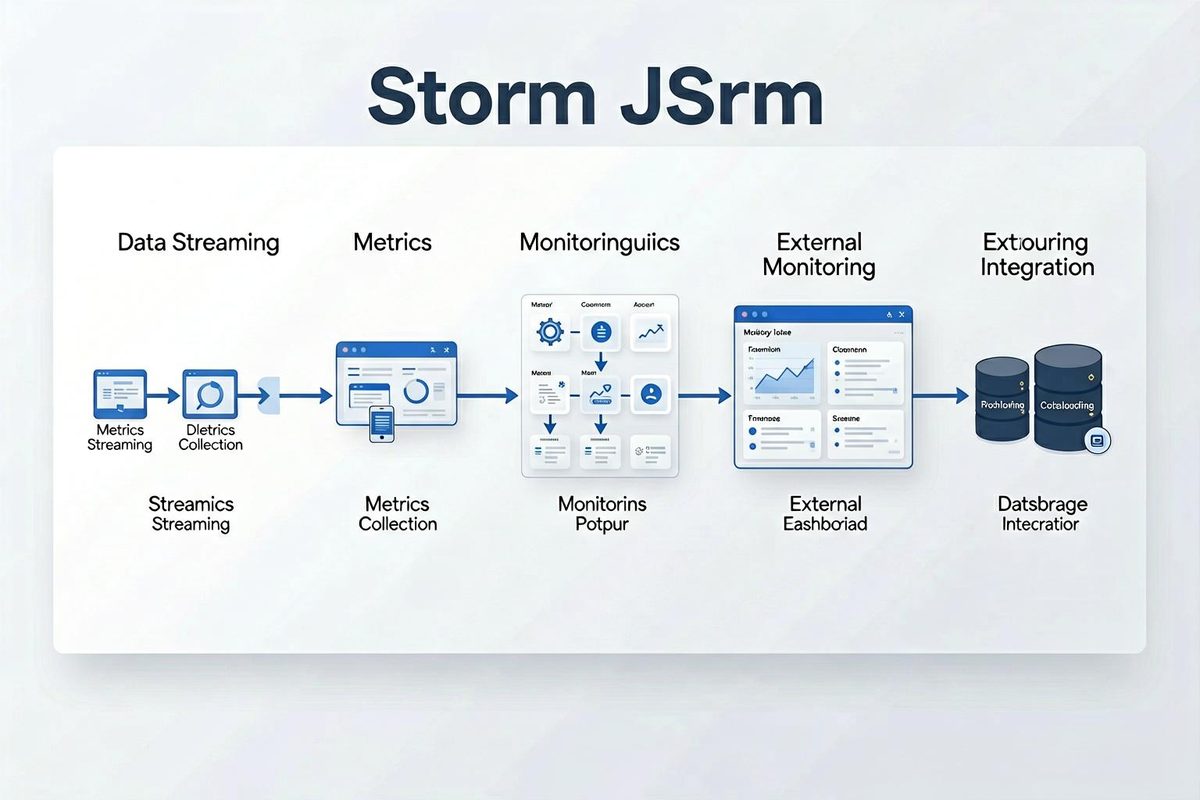
Compared to Storm, JStorm’s UI provides more detailed monitoring items. The UI itself is a WAR package running in Tomcat, making secondary development relatively easy.
Cluster Page
Cluster Summary, Cluster Stats, Topology Summary
Overall cluster information. The conf section contains the configuration of the nimbus node.
Topology Summary
A list of all currently running topologies along with summary information. The conf section corresponds to topology-specific configuration items.
Supervisor Summary
A list of all supervisors, where you can view supervisor configuration, logs, etc.
Topology Page
Topology Summary
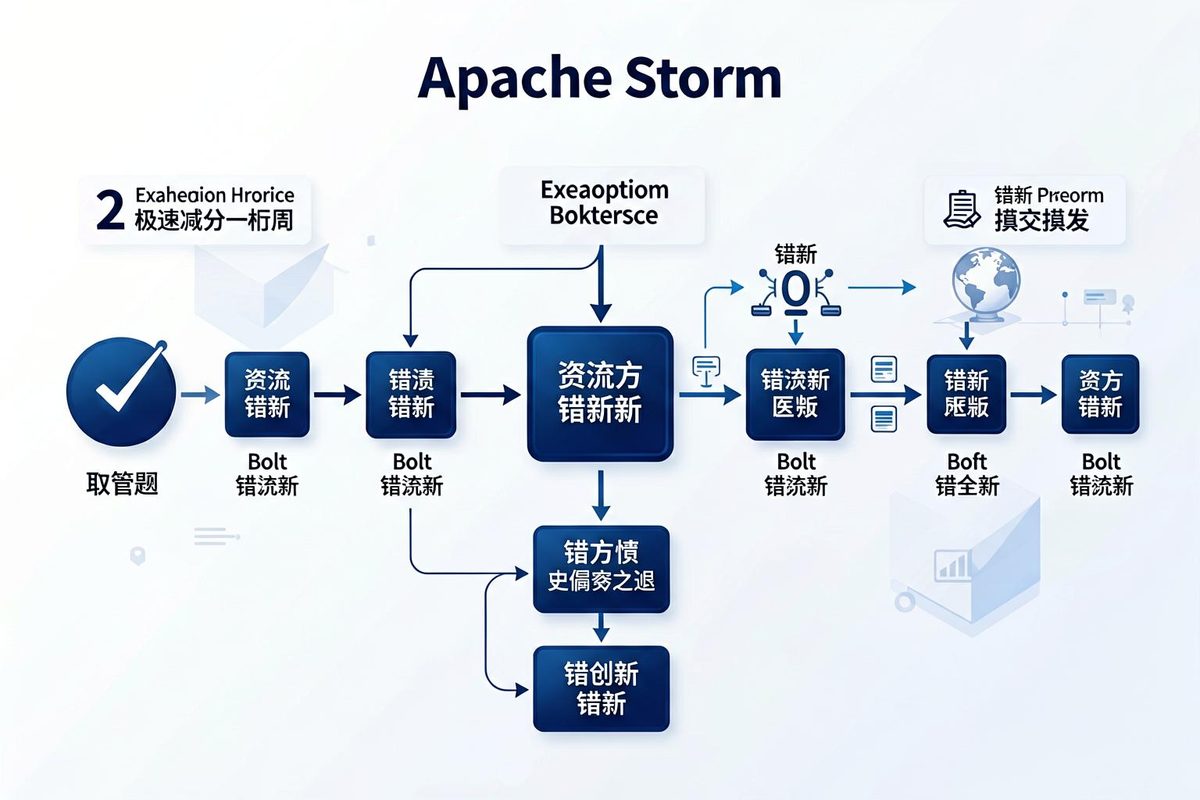
The main focus is on the Topology Graph section, which is a summary of the Component Metrics page and provides a relatively intuitive view of the running status.
Among these, node size and arrow thickness represent data volume, while node color is used to distinguish between spouts and bolts. Arrow color corresponds to the TupleLifeCycle attribute, going from green (fast) to red (slow). When arrows turn red, you can consider increasing the parallelism of downstream nodes.
Component Metrics
Contains statistical information for each spout and bolt.
Parameter descriptions:
tasks: Parallelism. Corresponds to the parallelism set for each spout/bolt in the code.
emitted, acked, failed: The number of messages emitted / received ack / not received ack.
sendTps, recvTps: Send / receive data TPS.
Note that the above interaction metrics include interactions with Storm’s own components (topology_master, acker), so they can only be used to check running status and are not suitable for statistical purposes.
process: For bolts, this is the execution time of the execute() function. For spouts, this is the time for the entire message (including all downstream steps) to be fully processed. This is the main parameter reflecting system operating efficiency.
TupleLifeCycle: The time from when an upstream message is emitted to when it is fully processed. When this differs significantly from process, it indicates the message spent a long time waiting in the bolt queue, and you may consider increasing concurrency.
deser, ser: Serialization / deserialization time, generally does not require attention. In Storm, every emitted piece of data requires serialization and deserialization.
error: Hover over E to view specific error messages. Mainly look for entries with exception stack traces; messages like “is dead” or “no response” do not require attention.
 微信
微信